

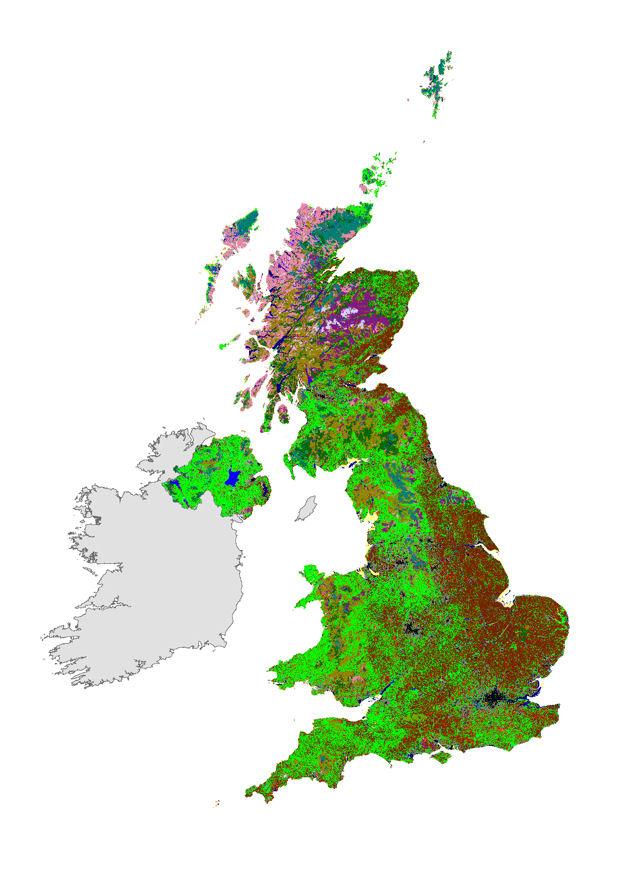
IMAGE: The Land Cover Maps show different types of land cover across the UK at a high resolution
view more
Credit: UKCEH
A major loss of grassland and significant increases in urbanisation and woodland in Great Britain since 1990 have been revealed in a new scientific analysis of land cover changes across the country.
Using high-resolution satellite-derived data, the UK Centre of Ecology & Hydrology (UKCEH) has calculated the overall net gains and losses in land cover over 25 years in Great Britain between 1990 and 2015. These show:
- a net reduction in all types of grassland (both farm use and recreational areas) of 7,668 km2 or 1.9 million acres – greater than the size of Suffolk and Sussex combined
- a net increase in woodland area of 5,236 km2 – almost the equivalent of the size of Norfolk – with the majority of this increase in Scotland
- a net increase in urban areas of 3,376 km2 – an area almost the size of Cornwall – with the majority in England
- a net reduction in arable farmland of 782 km2, with Scotland accounting for almost all this net loss. East Anglia also lost significant amounts of arable land, but there were increases elsewhere in England
- 2,505km2 of grassland (about the size of Dorset) and 1,121 km2 of arable farmland (almost the size of Bedfordshire) were converted to urban use
Kent had the largest net rise in urban land cover in terms of geographical area (136km2) between 1990 and 2015, while Edinburgh had the largest percentage increase (6 per cent).
Argyll & Bute lost the largest amount of grassland (739 km2) in Great Britain and gained the largest area of woodland (662 km2). This was symptomatic of the significant differences between England and Scotland, which lost a similar total net area of grassland between 1990 and 2015.
In England, grassland was largely replaced by urban development, while in Scotland, there was a massive expansion in woodland at the expense of grassland and also arable farmland, with much less urbanisation. In Wales, the picture was more balanced, with a similar increases in urban and woodland cover.
Dr Clare Rowland of UKCEH, who led the analytical study, says: “Thanks to sophisticated data analysis of high-quality satellite images, we have been able to produce the most reliable picture to date of the changes across the British landscape in recent years.
“Our data show the scale of grassland loss in Great Britain not only to make way for urban development but also woodland expansion. This information on how land cover in Great Britain has altered is crucial for understanding the impact of these changes on our environment, and helping us plan for the next 25 years.
“Overall, our data reveal a mixed picture, with significant differences in trends in changing land use between nations and counties.”
The data on the changing land use in Great Britain between 1990 and 2015 is being made available as part of UKCEH’s latest additions to its Land Cover Maps series, which show broad habitats across the country at a resolution of 25m or less.
Thanks to better quality satellite data and more advanced analytical computer software, UKCEH plans to release its state-of-the-art digital maps annually, and it has also just released UK Land Cover Maps for 2017, 2018 and 2019.
Data from UKCEH’s Land Cover Maps series can now be downloaded without charge for all non-commercial use.
Professor Bridget Emmett, Head of Soils and Land Use at UKCEH, says: “With a growing population, the increasing demand for housing, food and fuel must be balanced with protecting the wildlife and ecosystems that bring a range of vital benefits for humans. Knowing what we have on our land surface and where is crucial when it comes to planning developments and environmental improvements in the future, and our maps are therefore essential tools for government agencies, water companies, land managers, NGOs and researchers.
“UKCEH’s more frequent production of these maps, taking advantage of a step-change in satellite and data technologies, reflect the urgency with which these decisions now need to be made.”
Dr Daniel Morton, who developed the software for the new UKCEH Land Cover Maps, adds: “Producing land cover maps annually will enable the tracking of the UK’s progress towards the net zero emissions target by 2050 and the success of national tree planting initiatives, as well as give us greater ability to monitor vegetation responses to climate and land use changes plus extreme weather events.”
###
The developments in UKCEH’s Land Cover Map series are funded by the Natural Environment Research Council.
Notes to editors
1. The top 3 counties by urban increase were: Kent (136km2), Essex (113km2) and West Yorkshire (110km2);
The top 3 for woodland increase were: Argyll & Bute (662 km2), Sutherland (329km2) and Inverness (302 km2);
The top 3 largest arable losses were in: Norfolk (-215 km2), Essex (-143 km2), Cambridgeshire (-130 km2);
The top 3 grassland losses were in: Argyll & Bute (-739 km2), Devon (-508km2), Wiltshire (-325 km2)
A dropbox with infographics is available to media on request.
2. The datasets are produced from satellite data. The current methods cannot distinguish between different types of grassland, so this data cannot be used to split the grassland to urban conversion by grassland types such as farm grassland or playing fields.
3. UKCEH is launching five new Land Cover products (July 2020): Land Cover Change 1990-2015; Land Cover Maps for 2017, 2018 and 2019; plus a recreated 1990 Land Cover Map which takes account of various changes in methodology in recent years. The datasets are available to download in Raster and Vector format via the Environmental Information Data Centre (EIDC), which hosted by UKCEH.
See https:/
The new Raster datasets are available free for all non-commercial uses, meaning no charge for use within, or on behalf of, public sector, charitable and other non-profit organisations. The new Vector datasets are available free for the academic community in line with UKCEH’s policy of supporting environmental research, with charges applicable for other uses.
4. The new products complement UKCEHs existing Land Cover Maps representing years 1990, 2000, 2007 and 2015. The Land Cover Map of Great Britain 1990, produced in 1993, was the first digital land cover map for Great Britain derived from satellite imagery.
5. The Land Cover Maps are developed by UKCEH through the UK-SCAPE programme thanks to National Capability funding from the Natural Environment Research Council (NERC).
About the UK Centre for Ecology & Hydrology (UKCEH)
The UK Centre for Ecology & Hydrology is a centre for excellence in environmental science across water, land and air. Our 500 scientists work to understand the environment, how it sustains life and the human impact on it – so that together, people and nature can prosper.
We have a long history of investigating, monitoring and modelling environmental change, and our science makes a positive difference in the world. The issues our science addresses include: air pollution, biodiversity, biosecurity, chemical risks, extreme weather events, droughts, floods, greenhouse gas emissions, land use, soil health, sustainable agriculture, sustainable ecosystems, sustainable macronutrient use, and water resources management. The UK Centre for Ecology & Hydrology is a strategic delivery partner for the Natural Environment Research Council, part of UK Research and Innovation. http://www.
For media enquiries
For interviews and further information, please contact Simon Williams, Media Relations Officer at UKCEH, via [email protected] or +44 (0)7920 295384.


